What Good Energy Reporting Should Tell a Finance or Estates Team

If you are managing a large, multi-site business, you already know that energy has long moved past being a simple utility bill. It can now represent a significant operational and financial risk, with reporting and compliance requirements creating additional management demands. Yet, many executive boards are still expected to make million-pound resource decisions using nothing more than a stack of retrospective paper invoices and disjointed spreadsheets that fail to communicate across departmental lines.
Looking at your energy through a rear-view mirror does not work anymore. To truly protect your margins and run an efficient estate, you need business energy reporting that stops telling you what you spent, and starts telling you what to do next. For organisations reassessing their wider commercial energy strategy, What Is Business Energy Procurement? A Practical Guide for Large Organisations provides useful context on how procurement and reporting frameworks should operate together. True middle-of-funnel operational intelligence bridges the gap between raw data collection and strategic execution, turning passive line-item costs into active avenues for margin recovery.
Moving from Retrospective Energy Reporting to Real-Time Diagnostics
Most standard corporate energy dashboards do a reasonable job of aggregating basic monthly consumption figures. They will tell you exactly how many kilowatt-hours (kWh) a particular site consumed over the last thirty days. On paper, that satisfies basic historical accounting requirements and allows the procurement team to tick a box. In practice, macro-level monthly data may be insufficient to an estates team trying to spot active operational waste.
The fundamental flaw of monthly aggregation is its lack of interval data granularity. A single, flat consumption figure for a 30-day billing cycle compresses 1,440 half-hourly data points into a single metric. It provides no visibility into peak demand distribution, out-of-hours baseloads, or intra-day anomalies. It treats a site that runs efficiently 24/7 exactly the same as a site that leaks massive amounts of power every weekend but shuts down during peak hours.
Consequently, historical data may identify that higher costs or consumption have already occurred, but can be less useful for rapid operational intervention. It acts as an administrative record rather than an operational tool, offering no immediate path to mitigation and leaving facilities managers trapped in a cycle of reactive firefighting.
This creates a severe operational disconnect within the organisation:
- The Information Silo: The Finance team views energy as a fixed, uncontrollable overhead to be budgeted for, while the Estates team views it as a dynamic variable controlled by physical building physics and plant schedules. Because traditional reporting speaks only the language of retrospective finance, these teams cannot collaborate to stop active waste.
- The Diagnostic Blind Spot: Without real-time diagnostics, a facility manager cannot differentiate between a legitimate production-driven spike and an equipment malfunction. If a critical asset such as a variable speed drive (VSD) on a large air handling unit fails and reverts to 100% continuous output, that mechanical fault remains completely invisible on a standard spreadsheet until the end of the month.
By the time a high bill is spotted by accounts payable, flagged for review, routed to the estates director, and finally sent down to a local facilities manager to question, the operational anomaly that caused it has often been running unchecked for up to six weeks. You are not managing risk; you are simply archiving your losses.
Breaking Down the Forty-Day Structural Lag
Think about an unexpected 15% spike in power consumption at a regional distribution hub. Under a traditional reporting model, this anomaly remains completely hidden until the monthly invoice arrives four weeks later, followed by a typical ten-day processing window. This reactive model creates a critical structural delay. A forty-day lag between an operational fault occurring and a financial director noticing the line-item spike means thousands of pounds are permanently lost. This problem becomes even more expensive when businesses enter renewal periods without accurate operational data, a challenge explored further in 7 Costly Energy Procurement Mistakes Businesses Make at Renewal Time.
Furthermore, manual site audits are inherently flawed. Forcing a facilities manager to drive out and spend days manually inspecting a site’s physical assets, auditing building management system overrides, and interviewing floor staff relies too heavily on human observation to catch invisible system drift, calibration errors, or out-of-hours control anomalies.
Automating the Investigative Process via Multi-Variable Diagnostics
In contrast, mature energy monitoring systems can automate parts of this investigative process.. Instead of waiting for a bill, the reporting engine ingests raw half-hourly smart metering data natively. It then automatically cross-references that 15% spike against localised weather variables and production line volumes pulled directly from enterprise resource planning (ERP) systems.
This diagnostic reporting engine establishes a multi-variable framework that separates external, uncontrollable environmental factors from genuine on-site operational inefficiencies.
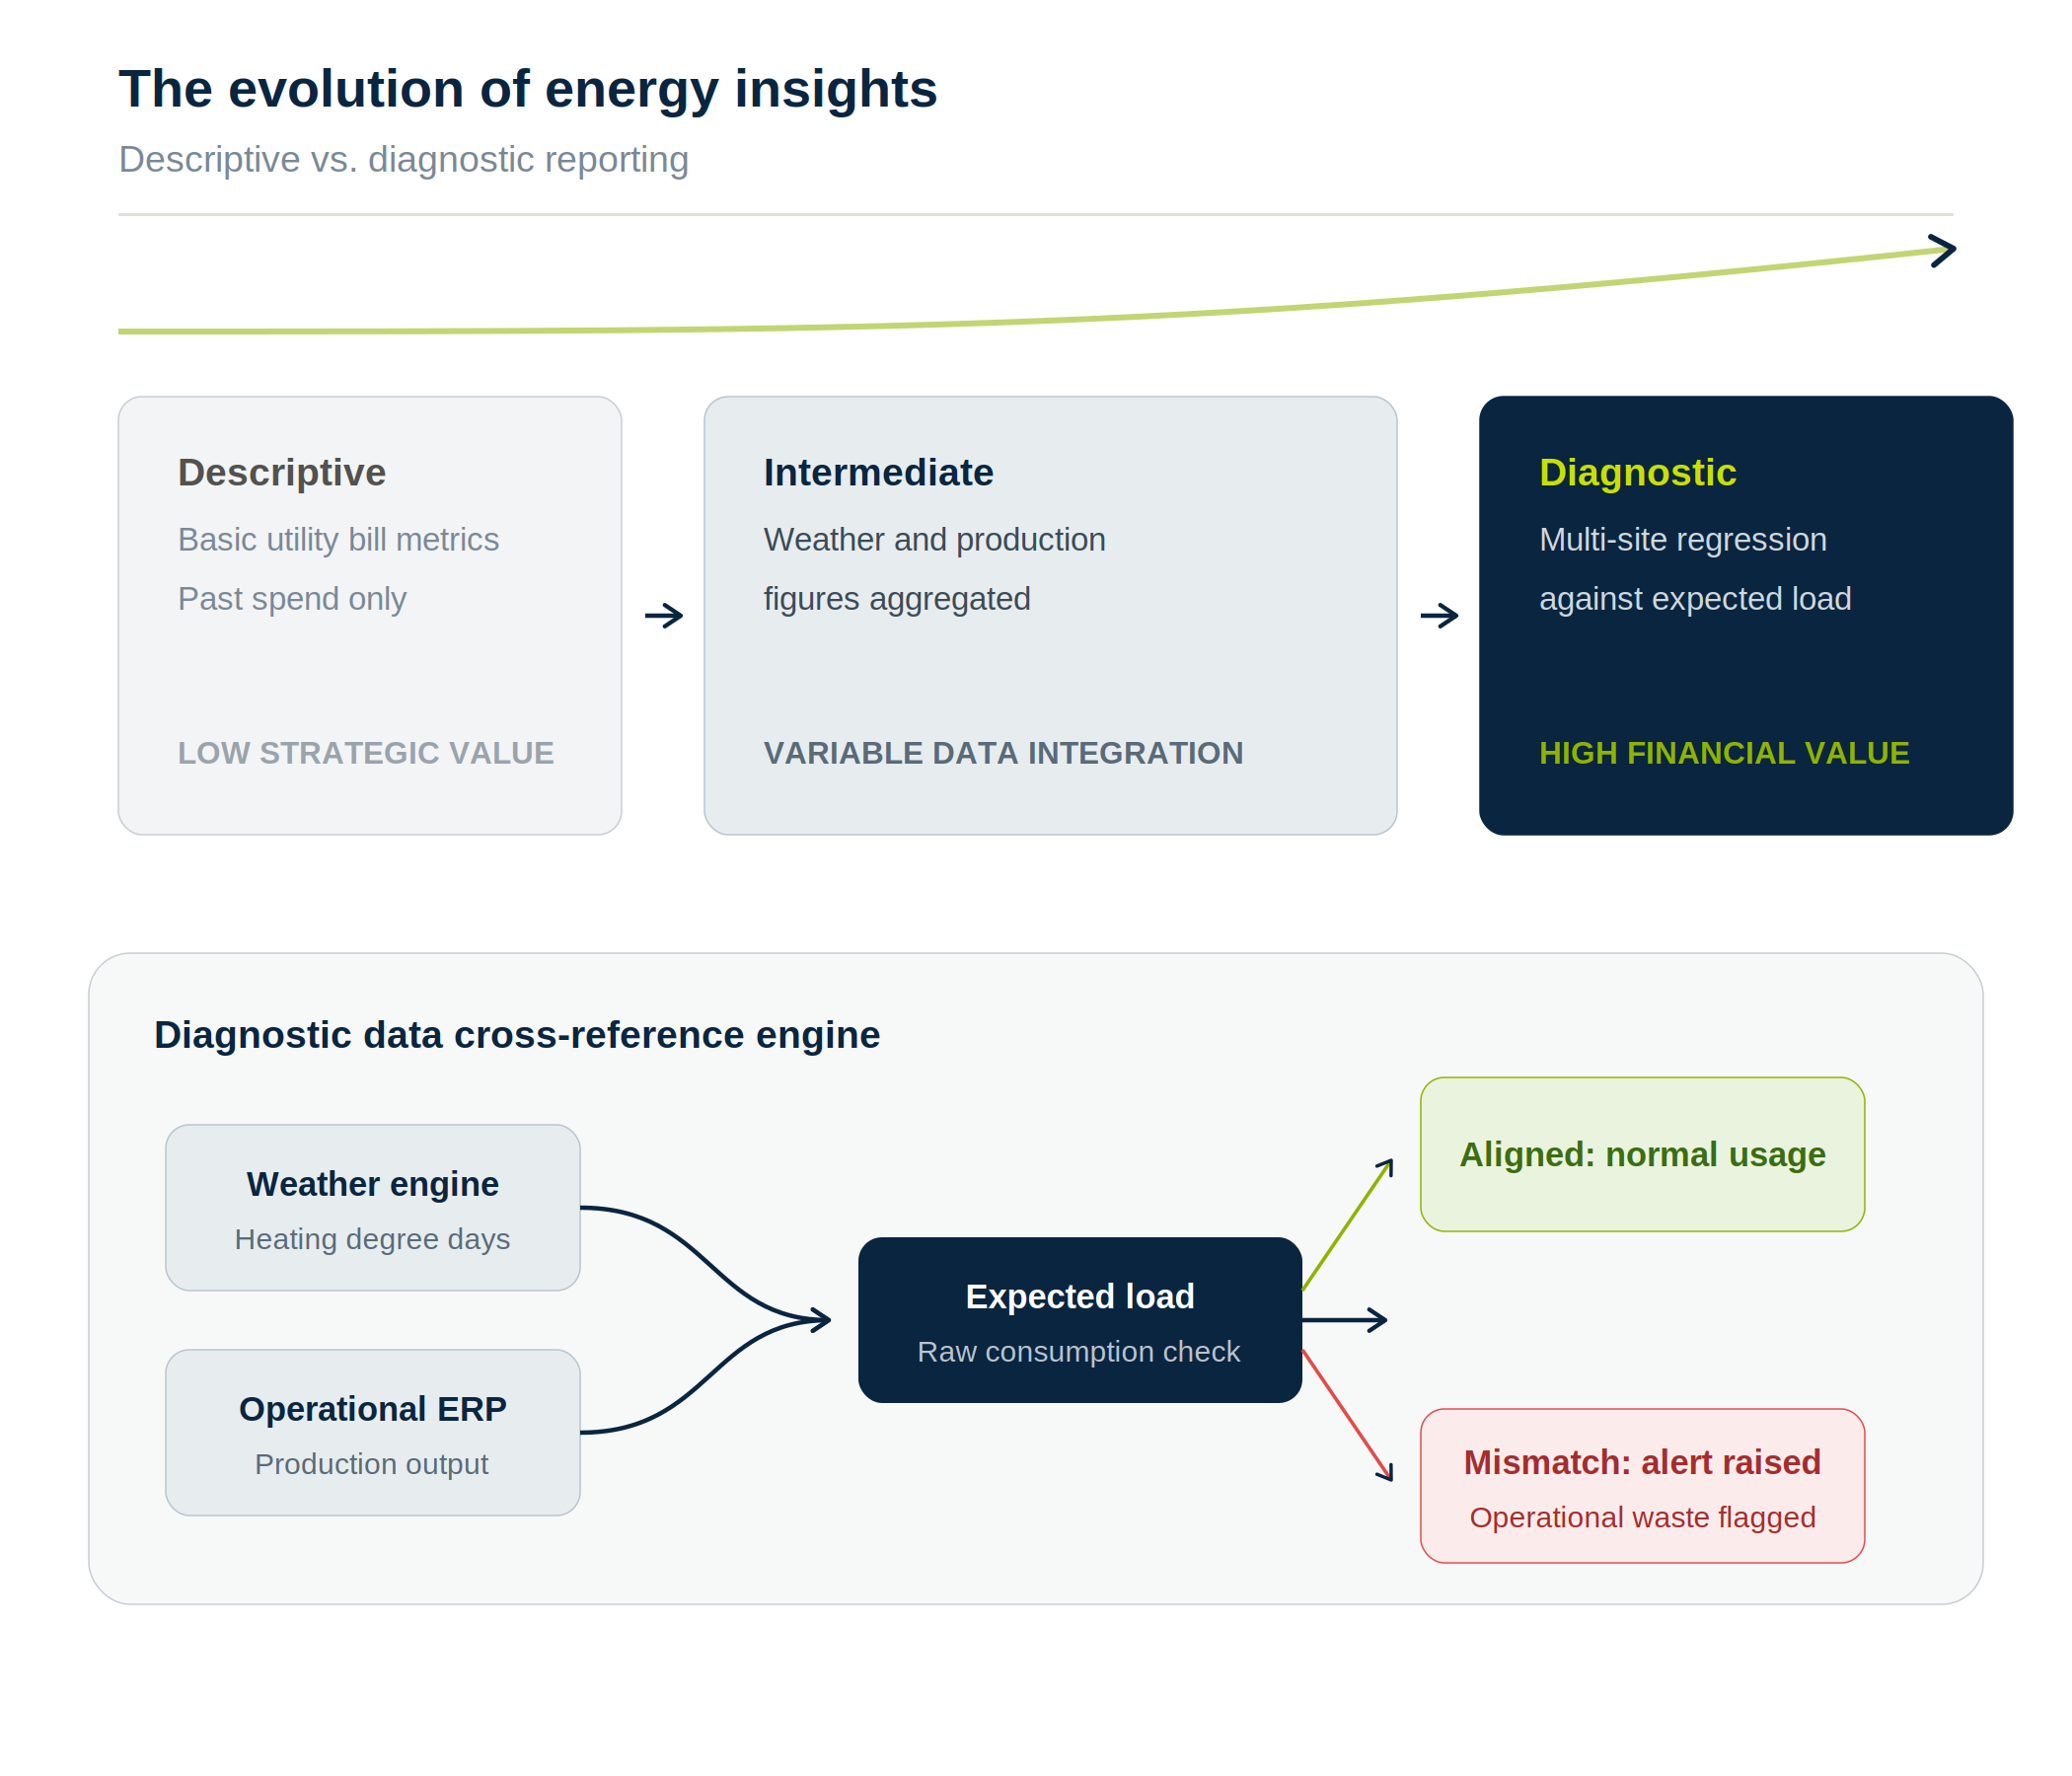
This regression model calculates a dynamic baseline of what the site should have consumed given the exact ambient temperature and manufacturing output of that specific day. By stripping out environmental anomalies, the system isolates true operational efficiency, creating a mathematically defensible performance baseline that adjusts organically as operational conditions fluctuate.
This shifts your energy data reporting from a history lesson into a diagnostic tool. As market volatility continues to place additional pressure on operational budgets, organisations are increasingly combining live reporting with strategic buying decisions. Suddenly, your finance team can use these energy insights to separate unavoidable cost increases caused by a sudden freeze from genuine operational waste.
For example, if the regression analysis shows that ambient temperatures were mild and production volumes were flat during the spike, the system instantly flags an operational anomaly. This allows teams to pinpoint specific, costly human errors long before they compound, such as a localised HVAC override that was left locked in “hand” mode, an industrial chiller short-cycling due to a blocked sensor, or a heavy heating schedule that was accidentally left running at full capacity across an entire vacant weekend. Identifying these faults more quickly can help reduce avoidable operating costs, converting your reporting framework from a cost centre into an active risk-mitigation tool.
“Standard utility reporting acts as a financial autopsy: it confirms that a budgetary loss has already occurred, but does nothing to stop it. High-grade reporting treats data as a live medical monitor, diagnosing systemic estate waste before it impacts your cash flow.”
Spotting the Outliers Across Your Estate
When you are responsible for a diverse commercial property portfolio, macro-level overviews hide the real problems. If you only look at your aggregate estate spend, you will completely miss the individual buildings that are quietly burning money.
This tracking failure is driven by the Flaw of Averages. Coined by statistician Sam Savage, the concept states that plans or budgets based on average assumptions are wrong on average, because they completely ignore the financial impact of variance and volatility.
The classic way to visualise this is the story of a hiker who cannot swim, standing at the edge of a fast-flowing river. A guide tells him that the average depth of the water is only three feet. Relying purely on that single average figure, the hiker decides it is safe to wade across. However, the river contains a ten-foot-deep trench right in the middle. The statistic provided to him was technically accurate—the mean depth across the entire width was three feet—but because the hiker relied on an average, he stepped into the trench and drowned.
When an executive board or finance team looks at a property portfolio through the lens of aggregated energy data, they are making the exact same mistake as the hiker. Consider how this materialises within business operations:
- The Masking of Asset Failures: Suppose an estate’s average monthly energy consumption across ten distribution centres is a perfectly healthy 45 kWh/m2.
On a corporate spreadsheet, this figure satisfies the budget and raises no alarms. However, that comfortable average is a mathematical illusion. It is being dragged down by two brand-new, state-of-the-art facilities running at an ultra-efficient 20 kWh/m2 which are completely masking an older site that has suffered a massive mechanical failure—such as an industrial chiller stuck in manual override—and is haemorrhaging cash at 85 kWh/m 2. The average “blurs” these sites together, leaving the broken asset invisible to leadership.
- The Surcharging Trap: Planning utility capacity or staffing shifts based on average daily power draw guarantees unexpected penalties. If a manufacturing site uses an average of 500 kW of power per day, finance will budget for that baseline. However, if the operational reality fluctuates between a low of 200 kW at night and a sharp spike of 1,200 kW during a midday shift change, the site will breach its Available Capacity (kVA) limit. The business is hit with severe maximum-demand surcharges and availability penalties that a monthly average completely fails to predict.
Relying on flat averages allows localised operational waste to quietly erode corporate margins, heavily subsidised on paper by your top-performing, optimised assets. To protect cash flow, high-grade reporting must abandon aggregate metrics and instead expose the distribution, variance, and high-resolution interval data of each individual building.
Estate-Wide Benchmarking and Asset Performance
For an Estates Director supervising a diverse commercial property portfolio, macro-level visibility is insufficient. True portfolio control relies on clear, site-by-site energy monitoring reports that establish standardised performance benchmarks regardless of differing asset ages, regional climates, or operating schedules.
To achieve true control, the reporting framework must map physical energy behaviour against a standardised operational matrix that translates raw electrical and thermal data into actionable engineering diagnostics:
| Metric Category | Standard Asset Signature | Anomaly Signature | Technical Root Cause & Financial Risk |
| Baseload Profile | Static, predictable overnight floor: Matches the absolute minimum power required to maintain critical life-safety systems, IT infrastructure, and basic security. | Creeping night-consumption: A baseline that gradually steps upward over time or fails to drop during non-operational hours. | BMS calendar errors; lighting zones left active; HVAC dampers stuck open; continuous compressed air or water leaks.
Financial Risk: Permanent expansion of fixed operational expenditure that directly erodes EBITDA. |
| Peak Demand Changes | Symmetric ramp-up: Power consumption increments align predictably with scheduled operational shifts and production startup sequences. | Erratic midday spikes: Sharp, localised consumption anomalies that break through expected operational ceilings. | Simultaneous heavy plant startup; lack of automated peak-shaving; manual overrides on industrial chillers.
Financial Risk: Immediate breaches of Contracted Capacity thresholds, triggering severe kVA financial penalties and maximum-demand surcharges. |
| Correlated Intensity | Linear variance: Energy consumption moves in tight lockstep ($R^2 > 0.9$) with actual building occupancy, pallet movement, or production volumes. | Decoupled utility growth: Energy consumption increases or remains high while physical output drops or stays completely flat. | Degrading mechanical Coefficient of Performance (COP) in HVAC units; heat exchanger fouling; unmetered tenant drift; short-cycling compressors.
Financial Risk: Accelerated asset depreciation and hidden efficiency loss that forces premature equipment replacement. |
Good business energy reporting highlights operational variances across identical properties within a corporate network. If two commercial assets with comparable square footage, regional climates, and operational shifts display a 25% variance in base utility costs, a structural efficiency deficit exists.
A robust reporting platform will normalise these comparisons by converting raw consumption into specific, cross-compatible Energy Intensity Indicators (EIIs)—such as:
- kWh/m2 of Gross Internal Area (GIA) for retail and commercial office footprints.
- kWh/m2 of Volumetric Space for cold-storage and conditioned logistics hubs.
- kWh per pallet moved or unit produced for manufacturing and distribution assets.
By ensuring your benchmarking data genuinely compares like with like, the reporting framework transforms raw data into an objective operational metric that exposes true mechanical performance across the entire estate.
Eliminating Capital Allocation Errors Through Normalisation
This normalisation process is critical for preventing capital allocation errors. For instance, an older facility that has undergone a comprehensive fabric upgrade may show higher gross consumption than a smaller, uninsulated site simply due to operational scale.
By evaluating assets on a normalised, regression-adjusted basis, the energy reporting framework reveals the true operational efficiency frontier of the estate. It exposes assets suffering from hidden operational degradation, such as degraded compressor seals, fouled heat exchangers, or drifted sensor calibrations that silently inflate the base load without triggering standard equipment alarms.
Auditing the Base Load Ratio During Dormancy Windows
Furthermore, enterprise reporting must provide an audit trail of out-of-hours consumption profiles to calculate your true Base Load Ratio. This is achieved by separating core operational hours from building dormancy windows.
If the platform flags a baseline profile creeping upward during scheduled building dormancy windows, it signals that automated shutdown schedules within local building management systems have been corrupted, bypassed, or manually countermanded by on-site staff. This targeted reporting prevents minor facility anomalies from hardening into permanent baseline budget inflation.
Data-Driven Prioritisation of Capital Expenditure
Strategic reporting surfaces these systemic variances automatically. By integrating advanced tracking frameworks into everyday facilities workflows, teams gain deep clarity into building performance anomalies.
These detailed data outputs empower estates management teams to utilise comprehensive monthly energy reporting and asset insights to prioritise capital expenditure allocations for building fabric upgrades, HVAC maintenance, or localised LED retrofits based on verified financial payback periods rather than generalised assumptions. This ensures that finite corporate capital is directed precisely where it will yield the highest carbon and financial return.
Protecting Cash Flow from Tariff Surcharges
While your estates team uses data to drive down demand, your finance director needs budget predictability. But as anyone who has looked closely at a commercial energy bill knows, the actual wholesale cost of power is only half the battle.
The real volatility often hides in non-commodity charges, the complex regional transmission fees and system balancing levies like Transmission Network Use of System (TNUoS) charges. With Targeted Charging Review (TCR) frameworks pinning down fixed baseline operations, identifying the remaining variable elements is critical. Many reporting packages gloss over these line items, listing them as general delivery fees, which leaves procurement teams entirely blind to the hidden charges eroding their margins.
Visualising Peak Pricing Surcharges
A sophisticated reporting suite separates these elements out so you can see them clearly. If your business routinely triggers peak demand surcharges by running energy-heavy processes during grid stress periods, your reports should explicitly put a pound figure on that behaviour. When penalty charges are displayed in stark financial terms rather than abstract electrical units, it becomes significantly easier for management to justify shift changes or operational adjustments.
Authorised Supply Capacity Optimisation
Additionally, your reporting must cross-examine your contracted Authorised Supply Capacity (ASC) against real-world peaks. If your data shows your actual peak demand never breaches 60% of your agreed capacity, your reporting suite should flag this as an immediate cost-saving opportunity, allowing you to downsize your kVA allocation and strip out thousands of pounds in unnecessary fixed penalties.
Conversely, if a site frequently breaches its ASC limit, the platform must issue an immediate warning before the local Distribution Network Operator (DNO) applies compounding, non-compliance surcharges.
Uncovering Reactive Power Surcharges
Advanced reporting must also monitor and expose Reactive Power charges, which are heavily penalised under regional Distribution Use of System (DUoS) tariffs. This inefficiency occurs when a site’s electrical equipment, such as large inductive motor drives or HVAC compressors, draws current that is out of phase with the voltage supply.
When a facility’s power factor drops below standard UK thresholds, local network operators apply heavy reactive surcharges. A professional reporting suite isolates this variance, calculating the exact financial payback period for installing local Power Factor Correction (PFC) equipment to turn an invisible penalty into a clear engineering payback model.
Navigating Time-of-Use Charging Matrices
Similarly, a mature reporting platform explicitly parses out your Capacity Market (CM) levies and specific regional DUoS red, amber, and green time-of-use tariffs. By correlating your half-hourly load profile directly against regional charging matrices, the reporting suite builds an interactive cost-velocity index. If your operational data shows that shifting a high-load process by just ninety minutes avoids a punitive peak band, the system automatically translates this operational modification into direct, cash-on-balance-sheet savings.
When you can see exactly how much those peak pricing windows are costing you, your procurement team can act. They can use 7 costly energy procurement mistakes businesses make at renewal time to design smarter risk strategies, helping you evaluate whether to transition from rigid, fixed-rate retail tariffs to more agile procurement options that shield your cash flow from peak market spikes.
Mitigating Governance Risks: Streamlining Mandatory Corporate Carbon Disclosures
Sustainability reporting is increasingly subject to governance and regulatory requirements, although the applicable obligations vary by organisation, jurisdiction and reporting framework. Preparing annual carbon compliance filings, such as Streamlined Energy and Carbon Reporting (SECR) or Corporate Sustainability Reporting Directive (CSRD) submissions, can easily turn into a multi-week spreadsheet nightmare for finance and operations teams, creating a massive margin for human error.
Managing Conversion and Compliance Risks
Manual data collection across a sprawling estate frequently introduces systemic data gaps, conversion calculation mistakes, and inconsistent fuel-factor applications. When these errors make it into final carbon filings, they pose severe regulatory compliance risks, including formal audit failures, financial penalties, and public reputational damage. Advanced reporting mitigates this risk by introducing automated, audit-ready calculations at the core of the portfolio framework.
Corporate Utility Data Pipeline: From Meter to Boardroom
Raw Half-Hourly Smart Metering Data
│
▼
Automated Validation & Invoice Reconciliation Audits
│
▼
Variable-Adjusted Portfolio Benchmarking Engine
│
▼
Executive Compliance Reporting & Carbon Matrix Dashboards
Automation from Meter to Boardroom
Advanced reporting takes the pain out of this process by automating data collection right at the meter. By converting half-hourly consumption streams directly into standardised greenhouse gas protocol formats, you eliminate the guesswork.
This automation process requires the reporting architecture to seamlessly map raw consumption data directly against the latest government-approved greenhouse gas conversion factors, handling complex dual-reporting methodologies for Scope 2 emissions:
- Location-Based Method: Reflects the average emissions intensity of the national grid where the energy consumption occurs.
- Market-Based Method: Reflects emissions from the specific electricity choices the enterprise has made through its supply contracts, such as certified Renewable Energy Guarantees of Origin (REGO) tariffs or Corporate Power Purchase Agreements (CPPAs).
Eliminating Greenwashing Risks with Traceable Data Trails
By natively parsing these datasets, your sustainability reporting suite removes the administrative burden of manually collecting supplier fuel-mix certificates. If your procurement team adjusts an energy contract mid-year to draw from a specific renewable asset, the system automatically routes the corresponding carbon factors to your compliance dashboard, ensuring your real-time carbon reporting matches your changing commercial structure.
This means when it comes time for formal board disclosures or external audits, your leadership team has access to a single, unassailable data set. Every carbon claim you make to stakeholders, lenders, or regulators is fully backed by an empirical, traceable paper trail that leaves zero room for greenwashing accusations, dramatically reducing the internal administrative hours required to close out your year-end compliance cycles.
Frequently Asked Questions
What is the difference between descriptive and diagnostic energy reporting?
Descriptive reporting simply states the volume of energy consumed in the past, such as a baseline monthly utility bill invoice. Diagnostic reporting combines consumption data with operational variables, including weather data via Heating Degree Days and manufacturing volumes, to reveal exactly why usage patterns changed.
How does multi-site energy benchmarking protect financial margins?
By comparing similar assets across an estate under a unified benchmarking framework, reporting isolates outlier properties that are operating inefficiently. This allows finance and estates teams to allocate capital expenditure to building improvements based on empirical data rather than guesswork.
Why should business energy reporting include non-commodity charges?
Non-commodity fees, including regional network charges like TNUoS and system balancing costs, make up a substantial portion of a corporate utility bill. Isolating these costs ensures businesses can adjust when they use power to actively avoid expensive peak network surcharges and spot where they are overpaying for unutilised capacity.
How can diagnostic reporting prevent billing errors?
Corporate energy invoices are notoriously complex, frequently suffering from supplier billing errors, incorrect tariff application, and estimated reads. Diagnostic reporting automatically validates every incoming bill against your raw half-hourly meter data and contract parameters, flagging discrepancies immediately so your finance team can dispute overcharges before paying the invoice.
What is the significance of the “base temperature” in degree-day reporting?
The base temperature is the outside ambient temperature at which a building requires no artificial heating or cooling to maintain comfortable internal conditions. In the UK, 15.5 degrees Celsius is a commonly used industrial baseline because internal heat gains from staff, machinery, and lighting typically bridge the gap to a standard indoor temperature of roughly 19 degrees Celsius. Advanced reporting suites customise this base temperature on a building-by-building basis to account for high-heat manufacturing environments or heavily insulated logistics hubs.
How does Market-wide Half-Hourly Settlement (MHHS) change standard corporate reporting requirements?
MHHS is a major market reform introducing market-wide half-hourly settlement arrangements. The implementation timetable, data flows and treatment of individual meters depend on the applicable market arrangements. Organisations should avoid assuming that MHHS automatically removes all estimated billing or creates a universal reporting-system requirement.
Transforming Data into Action
Data is only valuable if you actually use it to make changes. A beautiful dashboard won’t lower your wholesale market exposure or stop a faulty building management system from wasting power on its own. The real magic happens when automated data meets practical, human intervention.
When your reports highlight a creeping baseload anomaly or a site that is consistently breaching its capacity limits, it should immediately trigger a practical response. This is why connecting automated measurement with everyday energy reporting and management services is so critical.
Breaking Operational Silos for Margin Protection
True operational efficiency requires a feedback loop. Your data reporting engine must serve as the early warning system that directly informs your facilities maintenance schedules, your capital deployment pipelines, and your energy procurement strategies.
If your reporting functions in a vacuum, isolated from the teams who physically adjust your buildings or sign your supply agreements, your business will continue to bleed revenue.
If you are currently looking at your internal operations and trying to align different departments around a new strategy, it is well worth starting with our foundational manual, What does energy procurement mean for large organisations?. For a more commercial look at how these trading mechanisms impact your corporate bottom line, you can read our comprehensive Insights and Market Intelligence library. By breaking down the silos between your procurement teams and your facilities managers, you can increase the likelihood that identified issues are investigated and addressed promptly, helping to reduce avoidable costs.
Ready to optimise your portfolio? Contact Equity Energies to book a platform demo and consultation.